Here's something that took me a while to fully internalize as a creator:
Most of the time, your content isn't the problem.
The video is good. The product is solid. The audience is the right fit. You've got people watching, engaged, interested, and then they just don’t convert.
So you go back and refilm the hook. Tighten the edit. Rewrite the caption. A/B test the thumbnail. And you get a marginal bump, maybe. But the underlying issue is still there.
The problem isn't your content. It's the path between your content and the conversion. And the reason that path is broken is usually one thing: too many steps.
The Most Underrated Lever in Video Marketing
When creators and marketers talk about improving their numbers, the conversation almost always goes to content quality. Better hooks. More authentic storytelling. Trending sounds. Posting frequency.
What almost nobody talks about is funnel architecture, specifically, how to perform video funnel optimization by reducing the steps between interest and action. In video marketing, every additional step reduces conversion rates significantly.
This is one of the most researched areas in e-commerce, and the findings are consistent: every additional step in a purchase flow reduces the likelihood of completion. Not by a little. By a lot.
Baymard Institute, the gold standard for checkout research, found that 18% of US online shoppers abandon their cart specifically because the checkout process is too long or complicated. [1] One in five people who had already decided to buy were Lost to friction.
Now think about what that means for social video, where the person hasn't even fully decided yet, and you're asking them to follow a five-step detour.
You Already Have a Funnel, It’s Just Leaking
Most creators don't think of their content as a funnel. But that's exactly what it is, a series of steps between "viewer sees content" and "viewer takes action". For your video to sales funnel to be effective, you must identify where the leaks are. Most link in bio setups are the opposite of TikTok conversion optimization because they disrupt the user's flow and cause audience leaks. Let's map out what you're actually asking people to do to get the full picture:
Step > What the Viewer Does > Drop-off Risk
1. Watch Video > Engages with content, feels interest > Low, they're already here
2. Hear 'Link in Bio' > Decides whether to act on the cue > Medium, many scroll past
3. Navigate to Profile > Stops watching, taps username > High, disrupts watch state
4. Find the Bio Link > Looks for and taps the link-in-bio URL > High, extra action required
5. Land on Link Page > Opens third-party page, scans for correct link > Very High, decision fatigue sets in
6. Click Destination Link > Taps the actual relevant link > High, still hasn't converted
7. Take Action > Buys, signs up, books, downloads > Very High, all previous friction accumulated
Seven steps. Seven separate moments where a percentage of your audience makes a quiet decision to stop. Not because they don't like you or don't want your thing, but because the path got long enough that the moment passed. Identifying and resolving friction points through conversion funnel analysis is crucial to increasing video conversion rates. [4]
What One Less Step Does to Your Conversions
Let's make this concrete with real numbers because the scale of the opportunity is genuinely surprising.
The SnapScan video conversion tool shows what happens at 50,000 monthly video views, allowing creators to use the scan to convert approach to increase video rate conversions effortlessly. [5]
- Link-in-bio average click rate: ~1% → 500 visitors per month
- In-video QR scan rate: ~4.5% → 2,250 scans per month
- That's +1,750 additional people landing on your page every single month
Run those numbers through a basic revenue model, $40 product price, 3% purchase rate. You will find that this scan to convert technology can lead to an estimated $25,200 additional annual revenue, from the exact same content and the exact same audience. The 4.5x improvement isn't magic; it's the result of an innovative sequence designed to reduce friction in the video marketing funnel.
SnapScan's revenue estimate is based on internal modeling: $40 product price × 3% purchase rate × 1,750 additional monthly visitors. Real results will vary based on your audience, offer, and content quality.
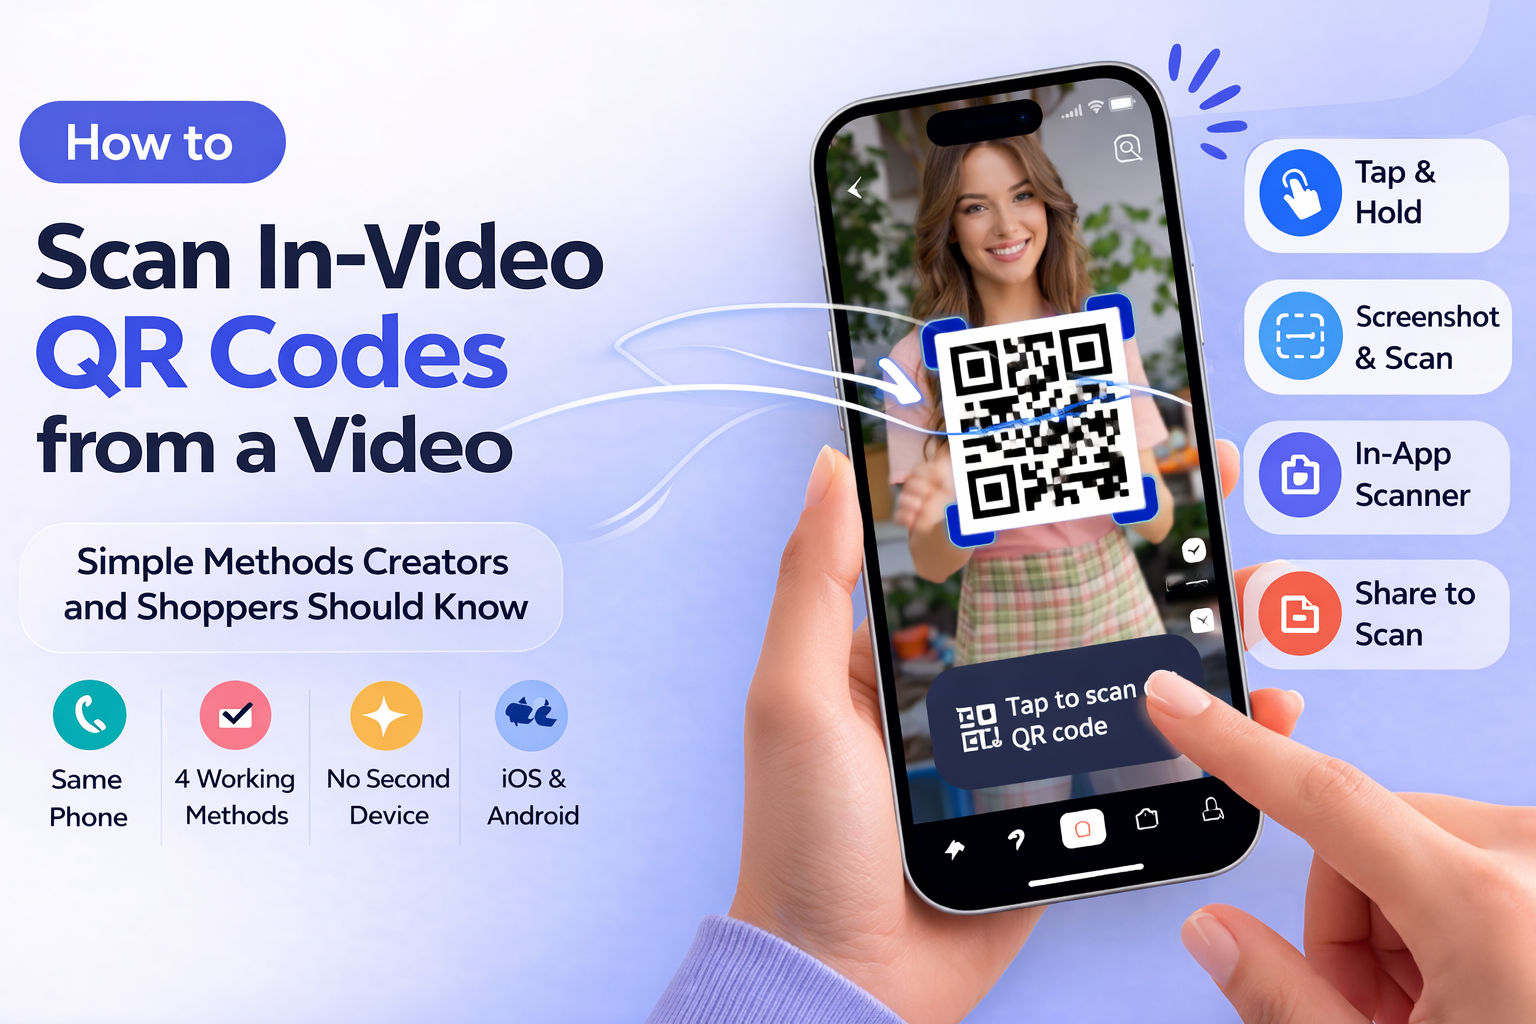
The Step SnapScan Removes and Why It Matters
In the context of video conversion optimization, the step that Snapscan in-video QR codes eliminate is the most expensive one in the whole funnel: the profile navigation detour.
Your current flow:
Watch → Leave Video → Go to Profile → Click Bio Link → Find the Right Link → Action
Snapscan in-video flow:
Watch → Scan → Action
That's not an incremental improvement. That's collapsing a six-step journey into three steps. And more importantly, it means the action happens while the viewer is still in the video, while they're still emotionally engaged, still in the mindset your content put them in.
You're not catching them after the video ends and the mood shifts. You're catching them in the moment the desire is strongest. That's the whole game.
The 4.5% vs 1% Question
So why does the In-Video scanning in Snapscan outperform bio clicking by 4.5x? It's not one reason, it's three working together.
1. Timing
The scan happens while the video is playing. The bio click happens after, when watch time has ended, the full-screen immersion is gone, and the viewer is already halfway into scrolling to the next piece of content. The same viewer is in a completely different mental state.
2. Effort
Watch, Scan then Buy. That's two actions. Finding a link in bio is five or six actions. Per everything we know about behavioral psychology, fewer decisions = fewer dropouts. [4] This isn't a theory. It's a pattern you can measure.
3. Emotional Context Preservation
SnapScan is a true link in bio alternative that shortens the audience journey dramatically without losing the emotional driving momentum. When someone scans inside the video, the first thing they see after scanning is your destination page. The emotional context from your video is still fresh. When someone navigates to your bio instead, they've passed through multiple interfaces, and by the time they land anywhere, the video's impact has already started fading.
The Attribution Advantage: Finally Knowing What Converts
Beyond increasing conversions, this shift helps you turn video views into conversions with full visibility. Snapscan actually improves what you know about your conversions.
With link-in-bio, your data trail goes cold almost immediately. Someone clicked a link on your Linktree, cool. But which video was it? Which moment in which video convinced them? You genuinely can't tell.
SnapScan QR conversion tracking gives you full attribution.[5] Every scan is tied to a specific video, a specific campaign, a specific moment. You see device breakdowns, geographic data, referral sources, and scan-to-conversion rates, all connected back to the exact piece of content that created the action.
For creators trying to figure out what content to make more of, this is priceless. For agencies trying to prove ROI to clients, it's literally what makes the conversation possible.
You stop guessing what's working. You start knowing.
REFERENCES
[2] Baymard Institute, "Average Cart Abandonment Rate" (2024). Cited via Contentsquare https://baymard.com