Analytics & Optimization
June 8, 2026

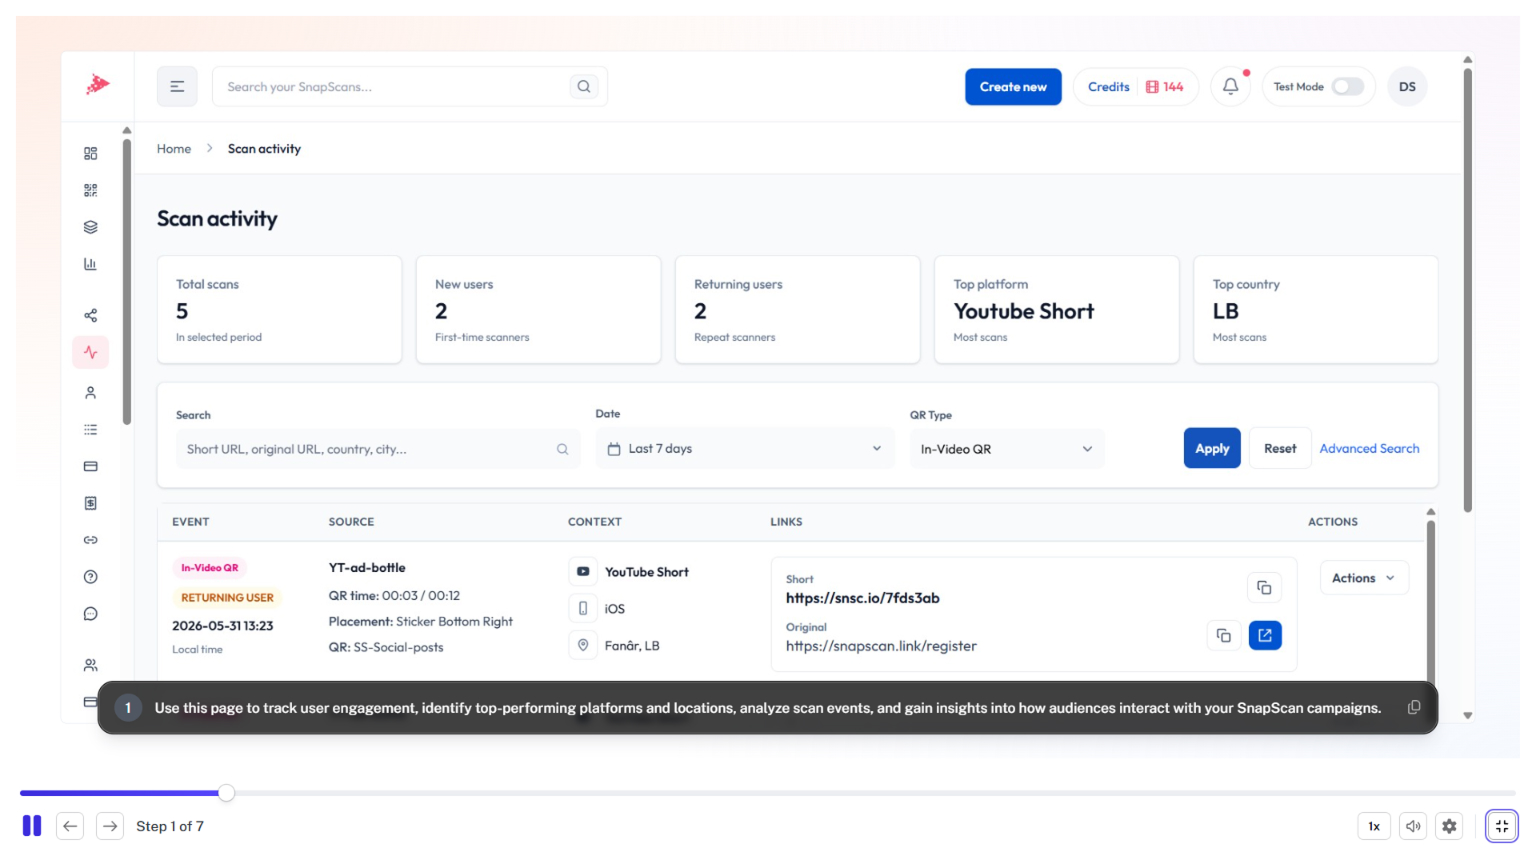
The Analytics Dashboard provides a complete view of your SnapScan performance data, helping you understand how viewers interact with your In-Video QR Codes, QR Codes, and branded links.
This walkthrough covers the key reporting tools available within SnapScan, including scan activity, click tracking, conversion metrics, geographic insights, device usage, campaign performance, and engagement trends. You'll learn how to filter reports, analyze data by campaign or asset, export analytics, and identify opportunities to improve conversions and audience engagement.
In this guide, you'll learn how to:
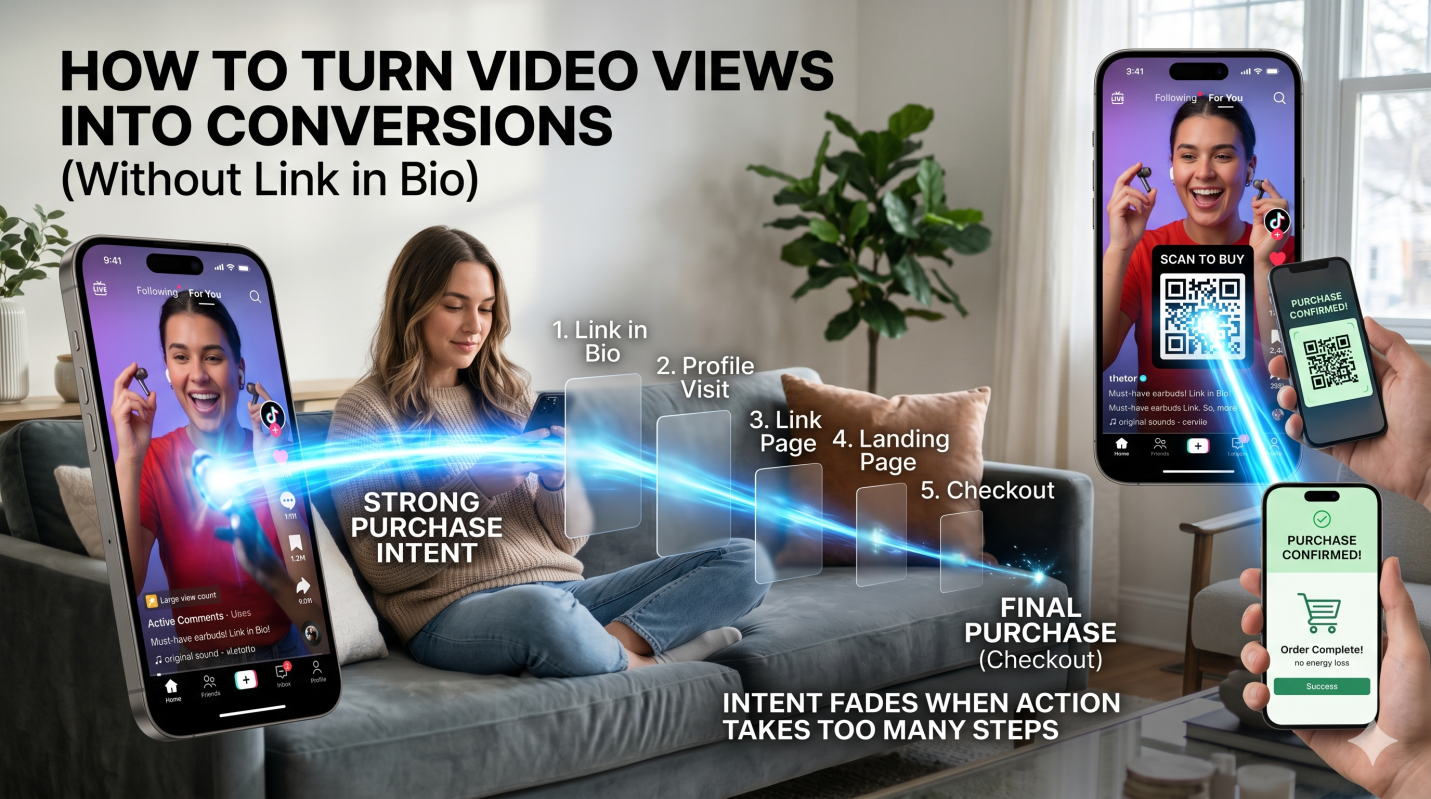
By understanding your analytics data, you can make informed decisions, improve campaign performance, and maximize the results of your SnapScan marketing efforts.
June 8, 2026
June 13, 2026
June 8, 2026